How to read the Dashboard
The OptionRoller Dashboard is designed to be clean and easy-to-understand. But in the event that our option terminology may be slightly different than yours, this post (which acts like a glossary too) can help clarify furthermore.
Features
There are several features within the OptionRoller Dashboard that you may want to pay attention to.
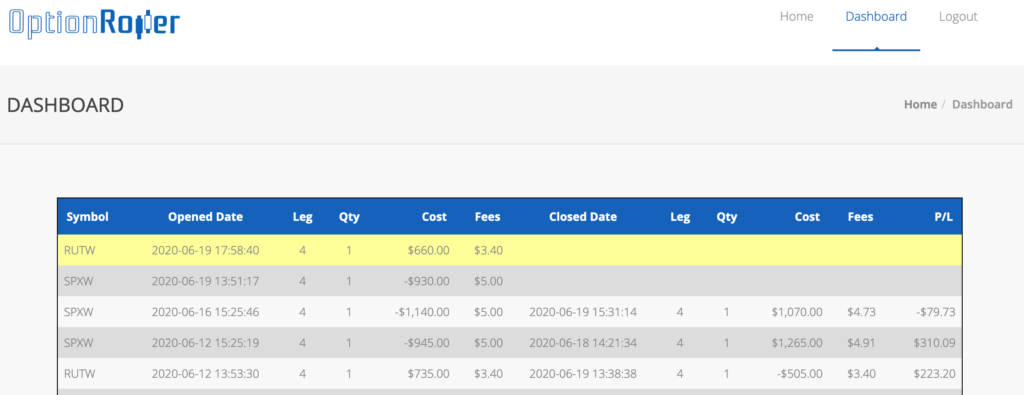
The top row in blue color is the HEADER row. It defines what are fields are displaying inside the dashboard. In mobile view, you may see that the number of fields change to order to optimize to your screen size.
Next, you see the row that is in yellow. That is the HIGHLIGHT row. It changes color when you put your mouse cursor over it. It is helpful when you are trying to focus the attention to a specific row, either for yourself or your audience.
Finally, the rest of the dashboard is being rendered in alternating colors of white and grey.
Now, let’s go through the columns:
Symbol
Symbol refers to the actual underlying asset that you are trading your option contracts with. It can be anything like a stock, an ETF, and index, or a Future.
One thing to notice is there can an additional letter after the actual symbol. Like in our example, SPX is being displayed in SPXW, and that is because it is a Weekly option, so you can read SPXW as SPX (Weeklys).
Opened Date
This is the timestamp when you opened up your positions. As sophisticated option traders, we all understand that this may mean multiple transactions, but the OptionRoller has machine learning (ML) algorithms to intelligently group them together as a single record.
Closed Date
This is the timestamp when you closed up your positions, for a profit or a loss. OptionRoller engages the same machine learning (ML) algorithms to not only intelligently group the closing transactions together, but also match them up with the corresponding opened transactions for accurate P/L results.
Leg (Opened Leg or Closed Leg)
Leg shows you how many transactions are involved in your single option strategy trade. For example, if you long a double calendar, you will see 4 here because it is a 4-legged strategy. Or if you short a bear put spread, you will see 2 in the leg column.
Qty (Opened Quantity or Closed Quantity)
Quantity (Qty) indicates how many contracts are in this trade. It goes by the standard option jargons, so a Qty of 1 means 1 contract, which also means controlling 100 underlying shares.
Cost (Opened Cost or Closed Cost)
Even though there are very minimum transaction costs nowadays trading options, there may still be “some” cost at times. OptionRoller will not let those costs (and fees, see below) get swept under the rug. One of our main goals is clarity, and that includes clearly stating how much you are paying for cost of trading.
Cost, in our case, means Commissions paid. This is money paid to your broker.
Fees (Opened Fees or Closed Fees)
Fees are different than Costs (or Commissions) because fees are being paid to the exchange (like SEC).
Fees, in our case, means Registration Fees and/or Options Registration Fees paid to the SEC.
P/L (Profit / Loss)
P/L is our bottom line. With OptionRoller’s ML algorithms, you can clearly see how much you are making (or losing) for each trade. You do not need to trace down your statement, highlighting the 4 opening trades from 1000’s of records, tracking down their credit/debit, their commissions and fees; only to know that you need to do exactly the same again for the closing trades, and finally at a point you know how much you make.
A positive dollar amount ($310.09) means you make money. A negative dollar amount (-$79.73) means you lose money.
Time is too valuable for us the option traders. OptionRoller Dashboard provides the single pane of glass so all your pages of option trading transactions can be summarized into a single report.
0